As the relationship between the Culver City Police Department and the community continues to be reexamined, the department is doing all they can to put their best foot forward. Several improvements to the CCPD monthly reports have been made in recent months leading up to a significant graphical overhaul and addition of Racial and Identity Profiling Act (RIPA) data in the Oct. 2020 report.
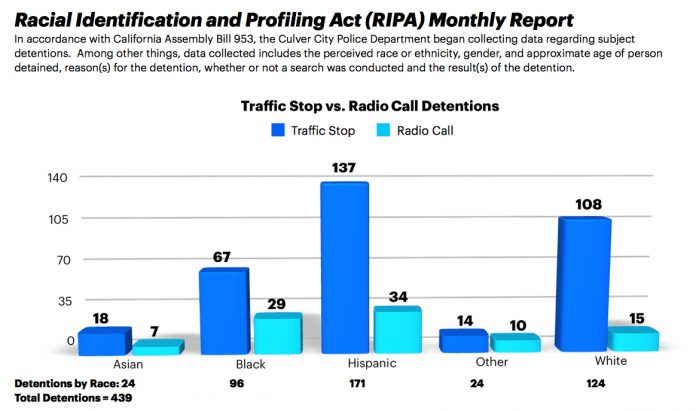
The Racial and Identity Profiling Act of 2015, designated as California Assembly Bill 953, is a bill which requires law enforcement agencies to report data on stops made as distributed by race. This includes the arrests resulting from traffic stops versus radio calls categorized by ethnicity, which shows a discrepancy between the two initiation methods particularly for Hispanics.
According to the report, 39% of the 439 total incidents resulted in a Hispanic subject being detained, and 80% of those incidents were initiated by police in a traffic stop. The Hispanic incident count is also the highest of any race in the city for the month, with Caucasian arrest numbers coming in as the second most at just under 30% of the total incidents resulting in arrests.
There is a very similar discrepancy between the initiation of the stops in Caucasians as well, with 108 (87.8%) traffic stop arrests compared to just 15 radio call arrests.
The remainder of the documented ethnicities did not have such extremes in their data. The third most common incidents documented with those with Black suspects, with 67 traffic stop incidents resulting in detention compared to 29 radio call incidents, making up 21.8% of total stops. Asian incidents bring up the back with 18 traffic stops and seven radio calls for 5.6% of incidents, and 14 traffic stops and 10 radio calls are classified under ‘Other.’
The general breakdown of the incidents by race lines up with the first wave of RIPA reports submitted to the California Department of Justice, which covered July 31, 2018 to Dec. 31, 2018 stops from the following departments:
- California Highway Patrol (CHP)
- Los Angeles Police Department (LAPD)
- Los Angeles County’s Sheriff’s Department (LACSD)
- San Diego Police Department
- San Bernardino County Sheriff’s Department
- San Francisco Police Department
- Riverside County Sheriff’s Department
- San Diego County Sheriff’s Department
This group represents the largest departments in the state, and the distribution has Hispanic (39.8%), White (33.2%) and Black (15.2%) making up the large majority of the arrests in a similar order that is present in Culver City.
The county also stratified its data slightly differently than Culver City did, splitting the arrests into two different categories that while different in title serve a similar purpose to Culver City’s labels. The first category is defined as “traffic violations,” which make up the large majority of arrests similar to traffic stops, while the second is defined as ‘reasonable suspicion.’
Notably, those perceived as Black were subject to ‘reasonable suspicion’ detention according to the data, with just under 20% of incidents involving a Black suspect being considered ‘reasonable suspicion.’ About 30% of incidents in Culver City involving a Black suspect was labeled under ‘radio call.’
Data on searches conducted during these detention incidents was also added to report as well. There were 95 searches conducted in October in Culver City with 35 yielding evidence. This 36.8% search yield rate is actually significantly higher than that of the initial RIPA pool, who reported no higher than a 24.3% yield rate for any race.
On top of these data additions, the Oct. 2020 monthly report also underwent a major graphical enhancement from previous editions. The new report now has brighter, more modern graphics with vivid 3D charts and improved clarity in tables.
These improvements should make it easier for interested residents to interpret the charts and the data that is presented within.
For more information, visit the Culver City Police Department website at culvercitypd.org.
